

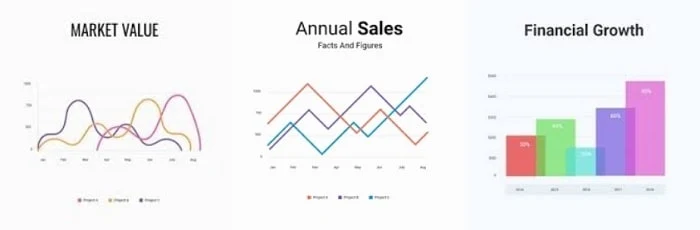
Is There Any AI That Can Make Charts and Graphs?
Artificial Intelligence (AI) has changed the world with its use cases, aiming to simplify long tasks in a matter of minutes. AI tools can do it all, even if you're talking about creating presentations, charts, writing long paragraphs, or essays.
For businesses, certain things are very important to grow such as creating roadmaps, managing projects, analyzing documents, creating charts & graphs, etc.
In this article, we'll look at the best AI software that can make charts & graphs. We'll also talk about these AI software's essential features and pricing for elaborative information.
So, without wasting any time further, let's get started.
BEST AI SOFTWARE FOR CREATING CHARTS AND GRAPHS
1. AppyPie - Free Graph Maker
AppyPie is one of the best AI chart and graph maler with lots of capabilities. It offers no-code development for creating professional charts. You don't really need any experience in graphics design. AppyPie can do it all. It also offers a simple, and drag-n-drop interface for creating extraordinary designs.
Key Features
- No-code development
- Cross-platform compatibility
- Drag-and-drop interface
- Pre-built templates and themes
- App customization options
- Integration with third-party services
- Real-time updates and preview
- App testing and debugging tools
- App publishing to app stores
- Analytics and reporting capabilities
- App monetization options
- Collaboration and team management tools
- Customer support and assistance
2. ChartGPT - Best Paid Chart & Graph Maker
ChartGPT, as its name depicts, is an AI tool that creates charts based on your data input. It is powered by ChatGPT and supports bar charts, line charts, area charts, and pie charts. All the generated charts are easily downloadable in JPEG or PNG format. It offers precise data visualization which is easily understandable by your team.

Key Features
- Natural language interface
- Automated chart generation
- Support for various chart types
- Customizable chart styles and designs
- Data import and integration capabilities
- Interactive and dynamic charts
- Data visualization recommendations
- Automatic labeling and formatting
- Real-time data updates
- Collaboration and sharing options
3. Chartify - Advanced Data Graph Maker
Chartify is an advanced data visualization, charts & graph maker. It features Python libraries for accurately designing graphs. It offers a high-level interface for creating simple yet useful visuals from your input data. It is built on Python's data manipulation library (Pandas), and the visualization library (Matplotlib).

Key Features
- Simplified API
- Support for various chart types
- Data transformation capabilities
- Interactive visualizations
- Automatic labeling and formatting
- Customization options
- Integration with Pandas and Matplotlib
- Python-based library
- Quick and easy chart creation
- Suitable for data analysts and scientists
4. Visme - Best for Different Infographics Templates
Visme is a popular web-based design and visualization software. It offers different useful tools for presentations, reports, and infographics. One of those features, Visme offers an easy-to-use chart & graph maker. It helps designers create amazing visuals, charts & graphs that don't require any designing or coding skills.
Key Features
- Visual communication platform
- Chart and graph maker
- Presentation creation tools
- Infographic design capabilities
- Report and document creation
- Pre-designed templates and themes
- Customizable designs and layouts
- Data import and integration options
- Interactive and animated visualizations
- Collaboration and team collaboration features
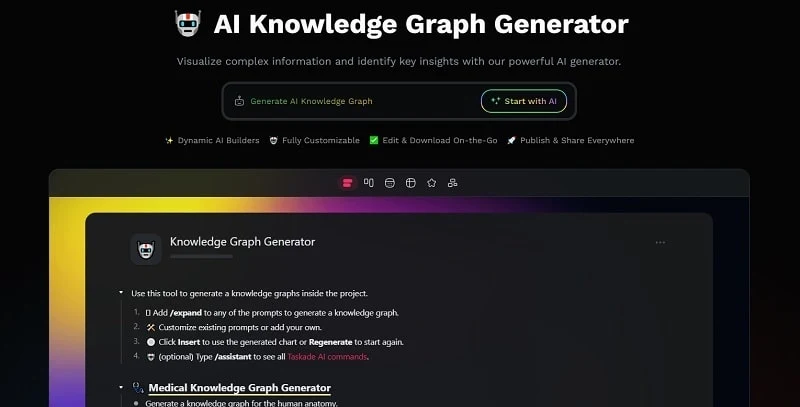
5. Taskade - AI Graph Generator
Although Taskade is popular for its task & project management tools. It also offers an AI Graph Generator, which is capable of creating wonderful data visuals. The most common use of Taskade AI graph generator is creating charts & graphs for comparing various entities such as Bar Charts for comparing a company's growth or comparing inflation rates over the years.
Key Features
- Interactive chart and graph creation
- Wide range of chart types
- Data input and import options
- Customizable chart styles and colors
- Labels and legends customization
- Real-time data updates
- Collaboration and sharing capabilities
- Integration with other Taskade features
- User-friendly interface
- Data visualization options
6. Plotly - Best Open-Source AI Chart Maker
Plotly is a popular open-source, AI chart & graph maker. It is used for creating amazing visuals for better data understanding. It supports various programming languages like Python, R, and JavaScript for creating high-quality, and accurate charts. Plotly is capable of creating line charts, scatter plots, bar charts, histograms, heat maps, 3D plots, and more.
Key Features
- Interactive data visualization
- Support for multiple programming languages
- Wide range of chart types
- Customization options
- Zooming and panning capabilities
- Hovering over data points for details
- Real-time updates and manipulation
- Embedding charts in websites and applications
- Cloud-based collaboration platform
- Data exploration and analysis capabilities
7. Graph Maker AI
GraphMaker.AI is a professional AI tool for making charts & graph software. lt is powerful enough to create visual representations in seconds. Graph Maker can easily create line charts, bar charts, scatter plots, and more.

Key Features:
- User-friendly interface
- Various chart types
- Customizable colors and styles
- Data import/export options
- Real-time data updates
- Collaboration and sharing capabilities
- Responsive design for multiple devices
- Zoom and pan functionality
- Data labels and annotations
- Trend lines and regression analysis
- Export to different file formats
- Print and PDF export options
- Multiple data series support
- Legends and data filtering options
- Interactive elements (tooltips, hover effects, etc.)
- Data visualization templates
- Undo/redo functionality
- Automated chart generation
- Integration with popular data sources
- Statistical analysis tools
- Data sorting and filtering options
- Data input validation
- Export/embed charts in websites or presentations
- Time series analysis features
- 3D visualization capabilities
8. Chart Blocks
Chart Blocks is an online, cloud-based data visualization software with capabilities to create charts & graphs with the help of AI. It offers drag-n-drop toolset for creating interactive graphics. Unlike some other charts & graph software, Chart Blocks offers pre-installed templates for different charts, and graphs.

Key Features:
- Wide range of chart types
- Customizable styles and colors
- Real-time data updates
- Data import/export options
- Interactive charts with tooltips and hover effects
- Integration with popular data sources
- Responsive design for various devices
- Collaboration and sharing features
- Embed charts into websites or applications
- Data filtering and sorting options
- Customizable data labels and annotations
- Multiple data series support
- Trend lines and regression analysis
- Export charts to different file formats
- Print and PDF export options
- Time series analysis features
- 3D visualization capabilities
- Statistical analysis tools
- Automated chart generation
- API access for advanced users
- Support for custom code and scripting
- Data input validation
- Real-time data streaming and updates
- Customizable chart animations and transitions
- Dashboard creation and management features
9. Graphy.App
Graphy is a data visualizing tool that features a clean platform for creating attractive graphs and also features a dashboard. You, as a user, can collect data from different sources, create attractive infographics including charts, graphs, and data reports, and then share them. It offers several beautiful templates, power-ups, and annotations that help you create charts that may increase your chance of rising in your company.

Key Features:
- Simple data import
- Variety of chart types
- Customization options
- Collaboration
- Embed & Share
- Offline access
- Instant Visualizations
Conclusion: Best AI Chart & Graph Maker
In conclusion, deciding which AI software is good for making graphs and charts depends on a variety of factors. However, the market has a number of amazing options that stand out.
With its user-friendly interface and no coding requirements, Appy Pie Graph Maker is available to a variety of people. Plotly offers robust interactive features, multilingual support, and data visualization capabilities. Users can create visually appealing and interactive charts using the Chart and Graph Maker Visme's full visual communication platform.
The best artificial intelligence (AI) tool for making graphs and charts will ultimately depend on the needs and features of each user.